INSIDE
RACING
T E C H N O L O G Y
IRT Home
IRT Home
News Page
Contents Page
Newsletter &
Books
email Paul
Shaker Test Data
The Data
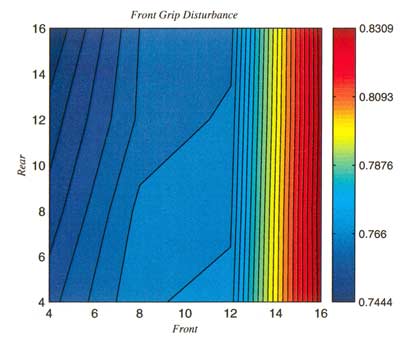
The numbers on the bottom and left of the graphs represent the increments of adjustment (detent clicks) from full hard for the front and rear shocks. At the lower left of each graph all the shocks are set for high forces and at the upper right they are all set full soft.
"We process the data statistically to minimize error," explains Hedlund. "Then we graph it as colored gradient lines. The bar on the right shows the overall range. A change 0.84 to 0.85 is something the driver can feel on the track. 0.85 to 0.90 is a big change. The graph is like a map. Blue is better, red is worse. The spacing of the lines is the gradient.
"Looking at each corner is an overall view. The lines show front-to-rear coupling if there is any. This is usually not the case in stock cars but open-wheel cars can have a lot of front/rear coupling. A shock change at the front can affect the rear of the car.
"The pitch dynamic balance chart compares the characteristic of the disturbance of the front and rear of the car. In the end the team needs to compromise and choose between optimum grip or minimum pitch disturbance. On a bumpy track they might minimize pitch. Driver feedback and a stop watch tells what works. Formula 1 teams allow pitch in search of more grip because most of the tracks they run on are so smooth. The Speedway at Indianapolis is smooth but there is enough high frequency disturbance on the track to excite a car in pitch."
Data Interpretation
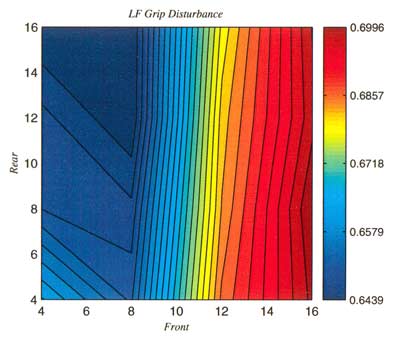
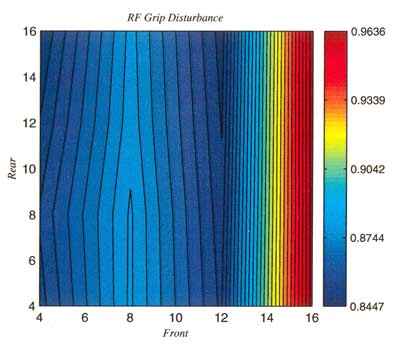
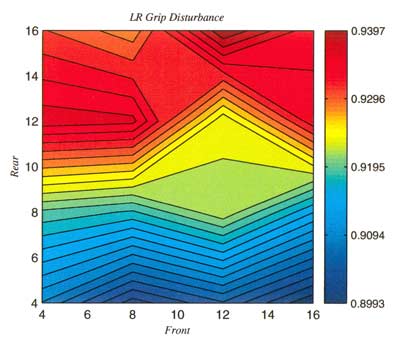
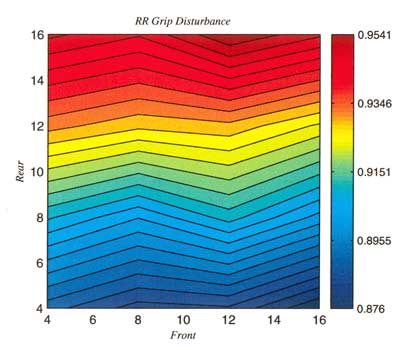
This first group of graphs shows grip disturbance data from each corner of the car during a low-speed test. The narrow vertical bar on the right of each graph is the range of the grip disturbance characteristic as calculated by the Öhlins method. Blue is better, red is worse. The graphs of the two front corners show lines running vertically corresponding to front shock adjustments and the lines on the two rear graphs are horizontal. This means the two ends of the car are decoupled.
The blue colors show stiffer damper settings are better. The numbers represent clicks from full hard so lower numbers are stiffer settings. The small distance between some lines and colors shows that relative disturbance can go from good to bad with just a few clicks of shock adjustment
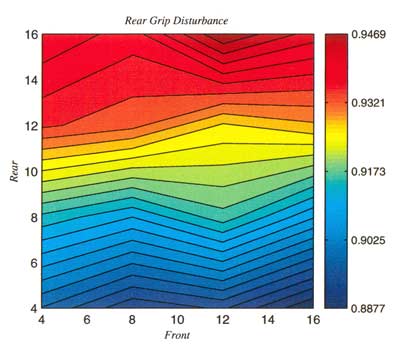
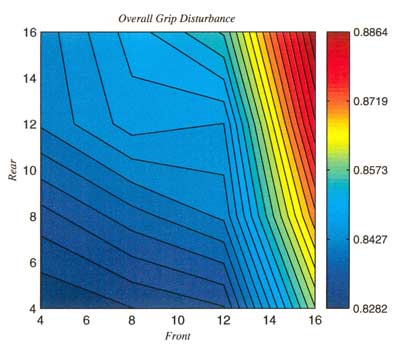
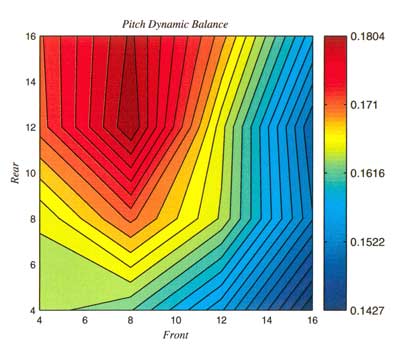
The second batch of data emphasizes pitch disturbance. On the top two graphs, depicting front and rear grip disturbance, the lines show that the front and rear of the car are decoupled and stiffer shock settings are better. The overall graph also recommends stiffer shock settings. But the pitch dynamic balance graph is more complicated showing an area of concern in the region of stiff front/soft rear settings. This is where compromise choices and track testing helps with the decision.
"We can input forces to the tires at higher frequencies than other methods," Hedlund said. "We're focusing on the tires, using the spring and damper to control the tire. You'd rather give up some body control to optimize tire forces, but driver feedback determines how far you can go in that direction. You're always compromising in racecar setups so the gradient format of this data is useful. The data becomes another tool the team can use to drive compromises."
Summary:
Racing is complicated. Race engineers need all the help they can get to help them find setups with more absolute grip and more controllable grip. Driver comfort will always be important. Compromise dominates the decision process.
Race teams need answers and dynamic testing is another tool providing data. The Öhlins method of data presentation shown here gives a test customer something to take away that points toward better and worse adjustments. But, as Mats Hedlund pointed out, on-track correlation is still necessary.
At the moment Formula 1 teams depend heavily on shaker rigs for both reliability testing and setup generation. CART teams also use shaker-rig testing to point them toward spring/damper combinations that minimize pitch sensitivity and maximize grip.
But race teams without shaker-rig experience might need to
generate a leap of faith in order to commit to a seven-post test.
But many top teams, both open wheel and stock car, are confirming
shaker-born setups with track testing and race results. Shaker
rigs seem destined to follow in the footsteps of wind tunnels
and become a must-have tool for top-level professional race teams.
Contact Ohlins in No. Carolina at 828-692-4525.